


When we are talking about major vital signs of a human body, there are four major parameters that we need to be aware of, they are body temperature, heart rate, breath rate, blood pressure, and due to COVID, oxygen saturation has become a major parameter that we need to be aware of. In this tutorial, we will be making a simple Arduino Nano 33 IoT-based device with multiple sensors. The device can measure some vital parameters of the human body. The device will be like a DIY multi-para monitor that you see in ICUs, a lot simpler and made of cheap sensors not meant for actual medical use. We will be using the new Arduino Nano 33 IOT for this purpose and we will try to make this device as simple as possible.
In our previous article, we have also built an IoT Based Raspberry Pi Heartbeat monitoring system, you can also check that out if you are interested. In this article, we will build a complete IoT based health monitoring system that can measure and monitor all vital parameters of the human body. So, let's get started.
Components Required for our Remote Patient Monitoring System
The components required for the project are very simple and can be found in a local hobby store. To build this particular health monitoring system using IoT, you will need the following components.
- Arduino Nano 33 IOT
- MLX90614 (Digital Non-Contact Infrared Thermometer)
- AD8232 (Heart Rate Monitor)
- MAX30100 (Pulse Oximeter and Heart-Rate Sensor)
- Audio (optional)
- Perfboard
- Jumper Wires.
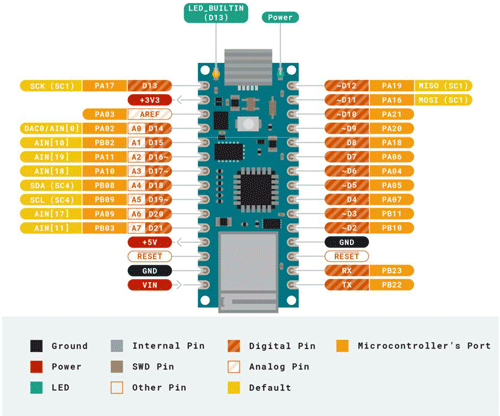
Arduino Nano 33 IoT
Arduino Nano 33 IoT is a relatively new Arduino board, and we will talk a bit about it. It is a direct upgrade to the original Arduino Nano, and currently available on the Arduino Store. It is cheaper than an original Arduino Nano, but the Nano is widely available at much cheaper rates as a clone. So, should you buy this new board when you could get a clone of the earlier generation? Are the upgrades worth it?
To be honest, it depends on your requirements. If you want to prototype with Wi-Fi and BT with some sensors in a compact form factor, it's recommended to go for it. From this standpoint, buying all the items separately and interfacing them is going to probably cost you more time and money than the Nano 33 IoT.
So, what upgrades does the new board have? Lots! The original Nano had no sensors, no connectivity, nothing. In contrast, the upgraded Nano 33 IoT packs a lot of features and power in the very same form factor.
- The board's main processor is a low-power Arm Cortex-M0 32-bit SAMD21.
- Wi-Fi 2.4G and Bluetooth connectivity is provided by the U-Blox NINA-W102 low-power chipset.
- The Wi-Fi / BT module antenna is made in the form of a metal fitting, protected from anti-vibration by a drop of thermal glue.
- Microchip ATECC608A crypto chip ensures secure communication, 6 axis IMU LSM6DS3
MAX30100 - Pulse Oximeter and Heart-Rate Sensor
The MAX30100 is also a Microchip based sensor module. It uses a concept called PhotoPlethysmography to measure vital stats, and as output, it gives a PPG graph. It works as shown in the figure below.
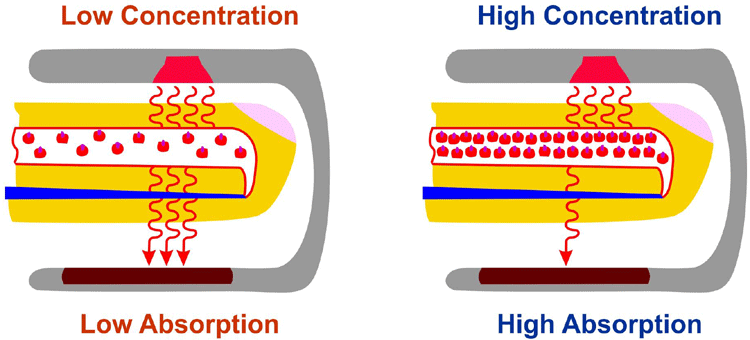
As you can see, an IR/Red/Green LED shines on the subject's finger. Depending on the heartbeats, oxygen diffusion in the blood, and a few other parameters, the value or rate of absorption of the incident wave changes. By identifying these alterations, we can determine the oxygen level.
The transmitted wave is then measured by a receiver which gives a voltage signal depending on the amount of light received. When light travels through biological tissues, it is absorbed by bones, skin pigments, and both venous and arterial blood. Since light is more strongly absorbed by blood than the surrounding tissues, the changes in blood flow can be detected by PPG sensors as changes in the intensity of light.
The voltage signal from PPG is proportional to the quantity of blood flowing through the blood vessels. Even small changes in blood volume can be detected using this method, though it cannot be used to quantify the amount of blood. A PPG signal has several components including volumetric changes in arterial blood which is associated with cardiac activity, variations in venous blood volume which modulates the PPG signal, a DC component showing the tissues’ optical property, and subtle energy changes in the body.
The MAX30100 sensor has an IR and red LED. Generally, heart rate and SPO2 parameters are measured, we will try measuring an additional parameter - HRV or heart rate variability.
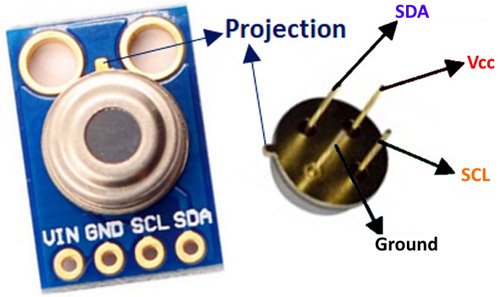
MLX90614 - Body Temperature Sensor
The MLX90614 body temperature sensor is from Melexis, which uses IR technology to measure the body temperature of a person. Commonly referred to as pyrometry, this sensor is like a single pixel thermal camera but has a very small range of less than 3 cm. Also, like other IR devices, the sensor reading error increases with the distance between the subject and the sensor. The image of the sensor is given below.
AD8232 ECG Sensor
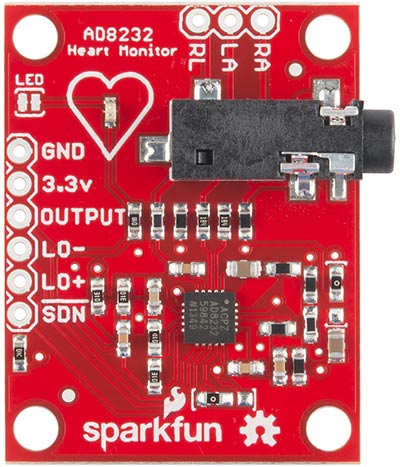
The AD8232 is a simple heart rate sensor that can be charted as an ECG. ECG stands for electrocardiogram. This sensor outputs its signal as an analog signal. The 3.5mm jack is used for biomedical pad connection.
Analog MIC Module
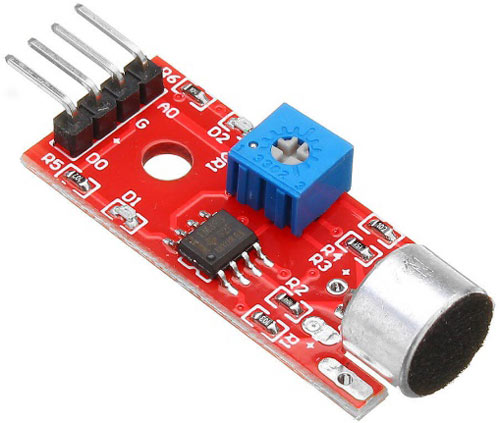
This is a simple sensor that records audio amplitude and outputs them as analog variations. This is useful in measuring respiratory signals but it requires a lot of signal processing and filtering. Hence, it will be covered in a separate blog. Beware, there are a lot of modules that do not feature an analog output (generally called clap sensors). They can identify sounds above a particular amplitude but are not useful beyond that.
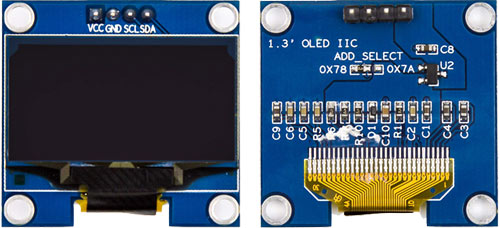
128X64 OLED Display
We will be using a 1.3” OLED I2C display for this project. There are a lot of generic ones in the market, so it might be possible that your OLED might be a bit different from mine. The Uglib2 library that we will be using has support for almost every display you can come across, so it's very simple to interface any OLED display with this library.
Circuit diagram for Remote Patient Monitoring System
The complete schematic diagram to build the Remote Health Monitoring System is shown below.
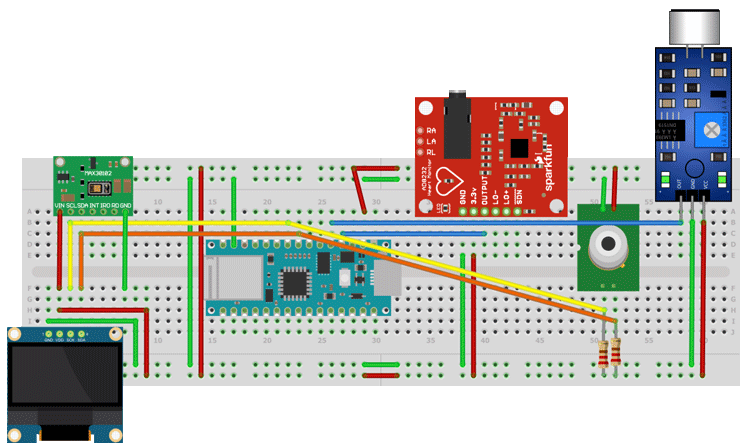
The schematic above shows all the necessary connections with the Arduino Nano 33 IoT. The two types of sensors used are analog (mic, OLED display, and AD8232) and I2C (mlx90614 and MAX3010X). The Arduino Nano 33 IoT pins used are:
- A0 – Analog output of ECG module AD8232
- A1 – Analog output of mic module
- A4 – SDA
- A5 – SCL
While working with the sensor and this board, you need to keep some things in mind. The working voltage in the above schematic is 3V3, as the ECG module operates at 3V3 and we don’t want unnecessary voltage conversions. The resistors used in the above schematic are 4.7k. They should suffice even for the 3V3 working voltage. We will not be using the extra pins LO+, LO- or  to reduce unnecessary complexity since this project already has many sensors working together. You can refer to the SparkFun ECG blog for their usage. The MLX90614 is available as a sensor or a sensor module. If you use the bare sensor, you will have to pull up the SCL and SDA lines as done in the schematic. Also, check which MLX90614 sensor series you are buying as there are many variants available, based on power input, type, etc. as shown below.
After assembling the board according to the schematic, the board looks like the image below. For convenience, I developed a simple GP board for this project as there were too many modules to the interface, and working on multiple projects using a single breadboard is difficult. It is also useful to have a GP board for the microcontrollers you use frequently to save time and unnecessary rework in projects using sensors you have already interfaced with before.
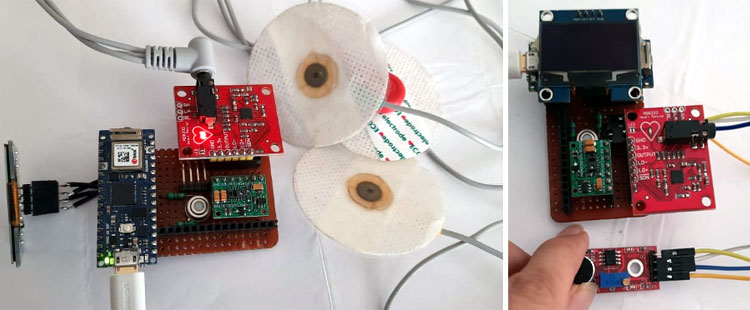
I would recommend that you place the MLX90614 and MAX3010X sensors such that they coincide and you can cover both of them together with a single finger at the same time. As for the coding part, I will try my best to explain it concisely.
Arduino Code to Measure and Monitor Vital Signs
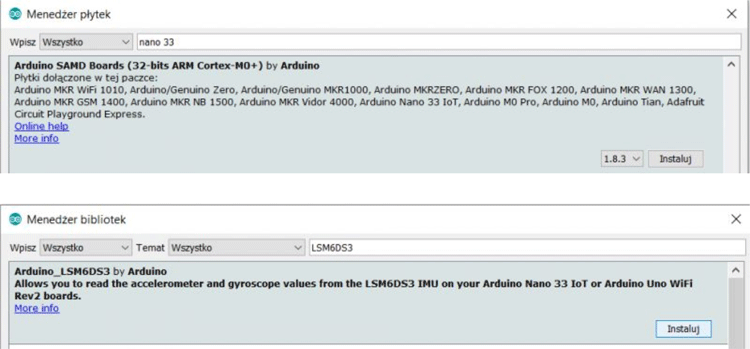
The complete code to build the human body visual signal detector is shown below, but before proceeding to the code, we need to install the required libraries, and you can find almost all of those necessary libraries in the Arduino board manager and we will install the libraries from there, we need to install the following libraries.
- Arduino SAMD boards
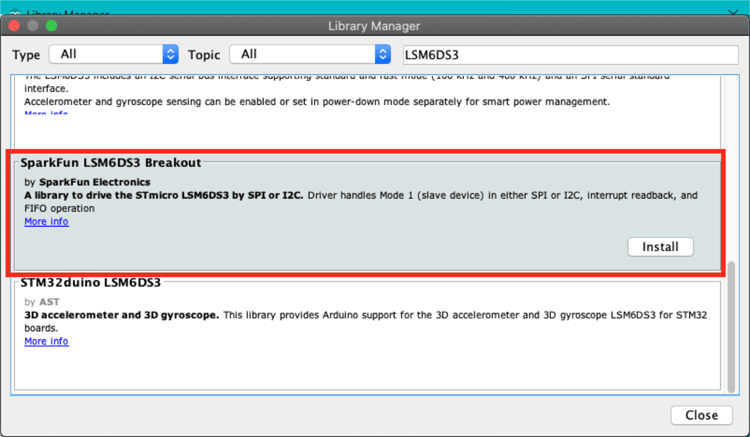
- Arduino_LSM6DS3 or Sparkfun LSM6DS3 Breakout (for advanced usage)
- Arduino WifiNINA
- Arduino BLE
Now let's install the libraries.
Other than that, we are also using the OLED Module. So, we also need to install the OLED libraries. The pulse oximeter sensor calculates SPO2, Heart Rate, and HRV using a concept called PPG or PhotoPlethysmoGraphy as explained earlier. The MAX3010X library can identify pulse or changes in reflectivity using a call-back function. That function is an interrupt that is called every time a heartbeat is detected. The interval between two consecutive heartbeats is stored to calculate the HRV parameter. The Heart rate is calculated every REPORTING_PERIOD_MS interval. Since the finger is used for measuring the body temperature, we add compensation to the value measured by the MLX90614 sensor.
SETUP Function:
//display connected
    u8x8.begin();
    u8x8.setPowerSave(0);
    u8x8.setFont(u8x8_font_chroma48medium8_r);
    Serial.begin(115200);
// Initialize the PulseOximeter instance
    if (!pox.begin(PULSEOXIMETER_DEBUGGINGMODE_RAW_VALUES)) {
        //Serial.println("FAILED");
        for(;;);
    } else {
        //Serial.println("SUCCESS");
    }
    // The default current for the IR LED is 50mA and it could be changed as shown below.
    //Check MAX30100_Registers.h for all the available options.
    pox.setIRLedCurrent(MAX30100_LED_CURR_11MA);
    // Register a callback for the beat detection
    pox.setOnBeatDetectedCallback(onBeatDetected);
// initialize MLX90614 sensor
   mlx.begin();
   time2 = micros(); // timer for future use.
LOOP Function:
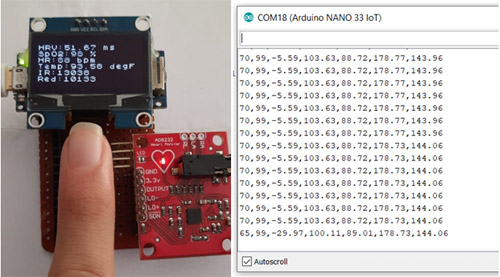
The loop function continuously takes signal variables (IR, RED, ECG, and mic values) and calculates parameter variables (HR, SPO2, HRV, ambient temperature, object temperature) at regular intervals (stored as REPORTING_PERIOD_MS). Once all variables and signal values are calculated, they are displayed on the OLED. Because the variable HR and HRV are extremely time-sensitive and dependent on how fast the heartbeat interrupt function is called after the actual heartbeat, we cannot update the display continuously. Hence, we update it after regular intervals (= DISPLAY_INTERVAL* REPORTING_PERIOD_MS). All the variables and signal values are also pushed serially in CSV format for data collection, plotting, and storage. The sample output is shown below. Telemetry format: hr, spo2, hrv, object_temp, ambient_temp, ir_signal/100, red_signal/100.
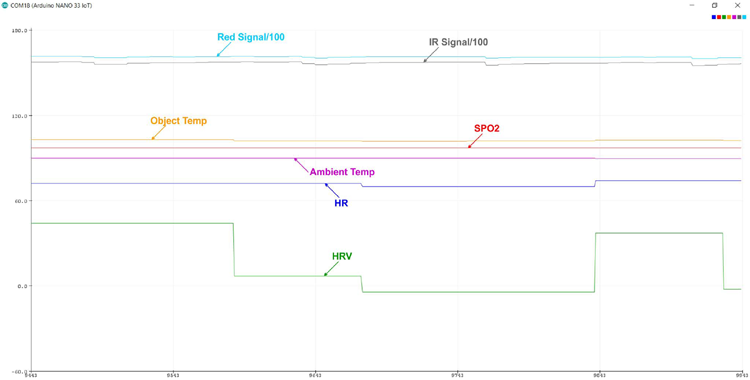
The serial plotter output for the same is shown below. The color key is shown on the upper right corner and is in the order of telemetry (hr, spo2, hrv, object_temp, ambient_temp, ir_signal/100, red_signal/100) from left to right. After plotting the data in the serial plotter window looks like the image below.
That is how our IoT-based patient monitoring system works. I hope you liked the article and learned something new. If you have any questions regarding the article, please comment down below.
#include <Wire.h>
#include "MAX30100_PulseOximeter.h"
#include "MAX30100.h"
#include <Adafruit_MLX90614.h>
#include <Adafruit_GFX.h>
#include <U8x8lib.h>
#include <avr/dtostrf.h>
#define REPORTING_PERIOD_MS 500 //update rate of hr, spo2, ambient, object, hrv, etc parameters in milli seconds
#define DISPLAY_INTERVAL 5 //update rate for the i2c display = REPORTING_PERIOD_MS*DISPLAY_INTERVAL
#define COMPENSATION 5 //compensation in object temperature. Different body parts have different temperatures. Fingers are around 5 degF lower than core body temperature
// objects
PulseOximeter pox; //this offers spo2 and hr calculation
Adafruit_MLX90614 mlx = Adafruit_MLX90614();
U8X8_SH1106_128X64_NONAME_HW_I2C u8x8(/* reset=*/ U8X8_PIN_NONE);
MAX30100 sensor;
//variables
uint32_t tsLastReport = 0;
int hr, spo2, count = 0, flag = 0, PatientID = 0;
float ambient, object, hrv;
long time1 = 0, time2 = 0;
uint16_t ir = 0, red = 0, ecg = 0, mic; ;
char str_hrv[10], str_object[10], str_ambient[10], str_ir[10], str_red[10];
// Callback (registered below) fired when a pulse is detected
void onBeatDetected()
{
time1 = micros() - time2;
time2 = micros();
}
void setup()
{
//display connected
u8x8.begin();
u8x8.setPowerSave(0);
u8x8.setFont(u8x8_font_chroma48medium8_r);
//pinMode(10, INPUT); // Setup for leads off detection LO +
//pinMode(11, INPUT); // Setup for leads off detection LO -
Serial.begin(115200);
/*
while (!Serial) {
; // wait for serial port to connect. Needed for native USB port only
}
*/
// Initialize the PulseOximeter instance
// Failures are generally due to an improper I2C wiring, missing power supply
// or wrong target chip
if (!pox.begin(PULSEOXIMETER_DEBUGGINGMODE_RAW_VALUES)) {
//Serial.println("FAILED");
for(;;);
} else {
//Serial.println("SUCCESS");
}
// The default current for the IR LED is 50mA and it could be changed
// by uncommenting the following line. Check MAX30100_Registers.h for all the
// available options.
pox.setIRLedCurrent(MAX30100_LED_CURR_11MA);
// Register a callback for the beat detection
pox.setOnBeatDetectedCallback(onBeatDetected);
mlx.begin();
time2 = micros();
}
void loop()
{
// Make sure to call update as fast as possible
pox.update();
sensor.update();
//reading continuous functions (signals) every loop
while (sensor.getRawValues(&ir, &red)) {}
ecg = analogRead(A0);
ecg = map(ecg, 250, 500, 0, 100);
mic = analogRead(A1);
delay(1);
// Asynchronously calculate other variables every REPORTING_PERIOD_MS
// For hr and spo2, a value of 0 means "invalid", for object and ambient temperatures a value less than 70 degF or higher than 110 degF can be considered abnormal
if (millis() - tsLastReport > REPORTING_PERIOD_MS) {
hr = pox.getHeartRate();
spo2 = pox.getSpO2();
ambient = mlx.readAmbientTempF();
object = mlx.readObjectTempF() + COMPENSATION;
hrv = (60000000/hr - (float)time1)/1000;
//send_serial();
tsLastReport = millis();
count++;
flag = 0;
}
//Display all variables on the display after DISPLAY_INTERVAL seconds
if ((count%DISPLAY_INTERVAL == 0) && (flag != 1)) {
flag = 1; //This flag makes sure the display is updated only once every DISPLAY_INTERVAL seconds
Wire.end();
send_display();
Wire.begin();
}
Telemetry();
}
//serial monitor print function.
//Not required actually as telemetry function prints all values in csv format on the serial monitor
void send_serial() {
Serial.print("bpm / SpO2:");
Serial.print("Heart rate:");
Serial.print(hr);
Serial.print(spo2);
Serial.print("% / hrv:");
Serial.print(hrv);
Serial.print("ms / Ambient:");
Serial.print(ambient);
Serial.print("*F / tObject = ");
Serial.print(object);
Serial.println("*F");
}
//display print function
void send_display() {
u8x8.clearDisplay();
u8x8.setCursor(0,1);
u8x8.print("HRV:");
u8x8.print(hrv);
u8x8.print(" ms");
u8x8.setCursor(0,2);
u8x8.print("SpO2:");
u8x8.print(spo2);
u8x8.print(" %");
u8x8.setCursor(0,3);
u8x8.print("HR:");
u8x8.print(hr);
u8x8.print(" bpm");
u8x8.setCursor(0,4);
u8x8.print("Temp:");
u8x8.print(object);
u8x8.print(" degF");
u8x8.setCursor(0,5);
u8x8.print("ecg:");
u8x8.print(ecg);
u8x8.setCursor(0,6);
u8x8.print("mic");
u8x8.print(mic);
//delay(200);
}
//serial telemetry for edge impulse data forwarder
void Telemetry() {
char buffer[150];
dtostrf(hrv, 4, 2, str_hrv);
dtostrf(object, 4, 2, str_object);
dtostrf(ambient, 4, 2, str_ambient);
dtostrf((float)ir/100, 5, 2, str_ir);
dtostrf((float)red/100, 5, 2, str_red);
sprintf(buffer,"%d,%d,%d,%d,%s,%s,%s,%s,%s,%d,%d",PatientID,count/10,hr,spo2,str_hrv,str_object,str_ambient,str_ir,str_red,ecg,mic);
Serial.println(buffer);
}


 Platform")


